Independent analytics case study · SQL · Python · Tableau
Subscription Product Analytics
An end-to-end analysis of the subscription lifecycle: where users enter, where they leave, and which onboarding outcome justified a rollout.
40Kusers analyzed
303Kproduct events
+2.9 ppconversion lift
Context & role
Context: A subscription product needed a clear view of acquisition quality, activation, retention, and paid conversion. My role: Independent product analyst - responsible for the SQL analysis, Python validation, experiment readout, and Tableau executive dashboard.
The problem / decision
Which acquisition channels and early behaviors create subscription value - and should a higher-converting onboarding variant roll out?
Method & artifacts
Analysis path
From event data to decision
- Built funnel, cohort-retention, and churn views with SQL CTEs and window functions.
- Compared channel performance and payment outcomes in Python.
- Validated the onboarding A/B test with SRM checks, two-proportion z-tests, confidence intervals, and ARPU guardrails.
Key signals
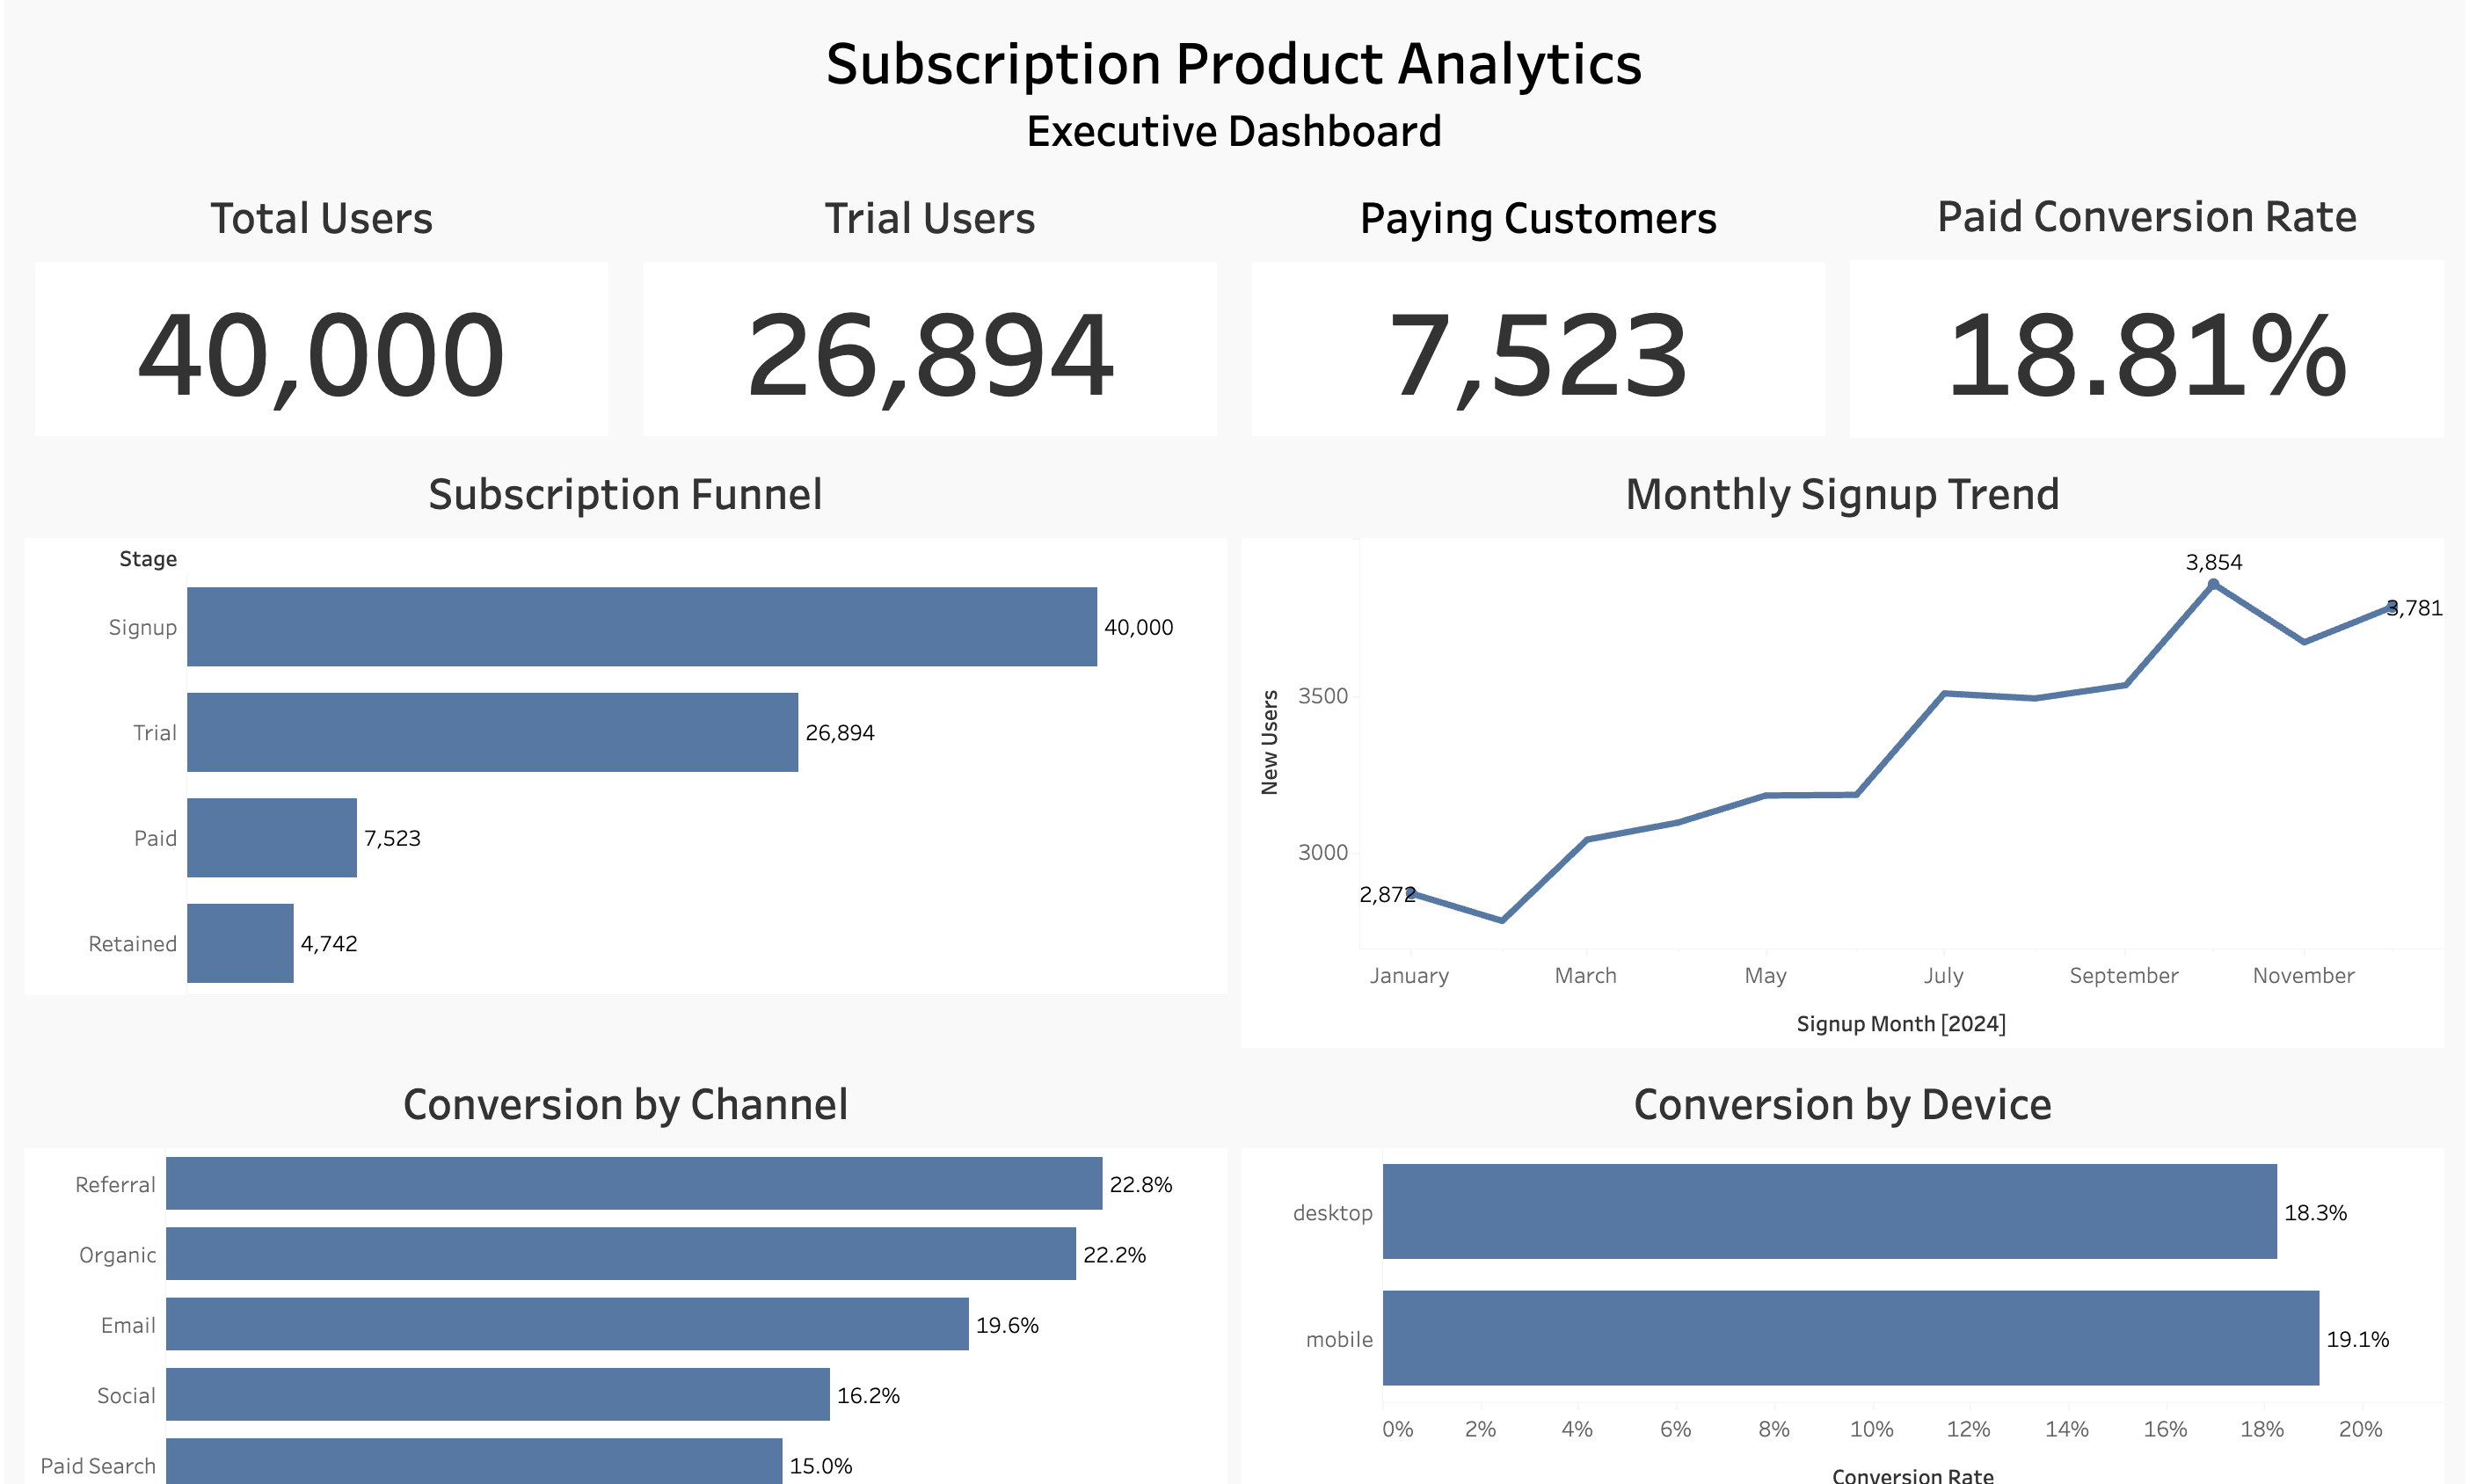
Referral22.8%
Organic22.2%
Email19.6%
Recommendation & outcome
The analysis found 37% churn and about $43K in MRR at risk, while Referral and Organic performed best on conversion. The onboarding variant improved conversion from 17.4% to 20.2% (+2.9 percentage points, p < 0.001), supporting rollout.
What I would measure next
After rollout, monitor conversion lift by channel and device, first-30-day retention, ARPU, and support contacts. A durable win should improve paid conversion without simply moving churn downstream.
SQLPythonTableauA/B testingCohortsFunnel analysis